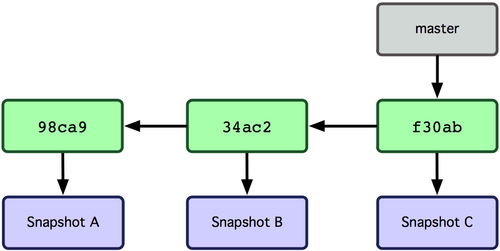
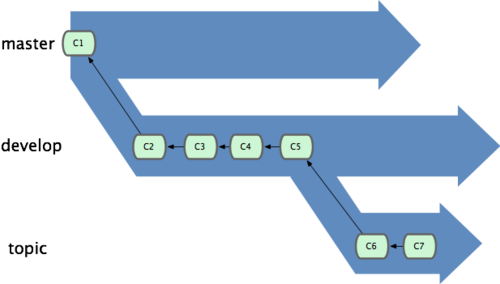
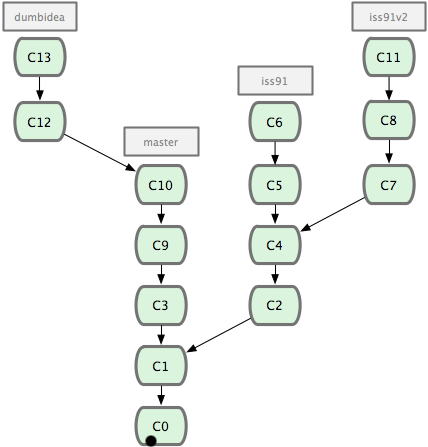
class: middle # Welcome to Advanced Software Engineering #### Global Software Engineering in Open Source and its Effect on Quality Helge Pfeiffer, Associate Professor,<br> [Research Center for Government IT](https://www.itu.dk/forskning/institutter/institut-for-datalogi/forskningscenter-for-offentlig-it),<br> [IT University of Copenhagen, Denmark](https://www.itu.dk)<br> `ropf@itu.dk` --- <img src="https://coursemarks.com/wp-content/webpc-passthru.php?src=https://coursemarks.com/wp-content/uploads/2020/11/2267906_505c.jpg" width="30%"> ## Learning Objectives After this session the student will be able to: * Understand how VCS histories and issue tracker data is collected for research. * Analyze the history from Git repositories and the Jira issue tracker. * Apply scripts and programs in various languages to clean and pre-process the exported data. * Create scripts and programs to analyze Git VCS and Jira issue tracker data to investigate certain research questions. * Interpret analysis results to either better understand current practices or to suggest actionable changes of current practices in software engineering. --- # What are we doing today? * Discussion of the papers that you read * Brief recap of branching strategies * Research in groups to investigate key result of the paper --- ## You all read the two following papers: * E. Shihab et al. ["The Effect of Branching Strategies on Software Quality"](https://www.microsoft.com/en-us/research/wp-content/uploads/2016/02/shihab-esem-2012.pdf) * M. Cataldo et al. ["Software Dependencies, Work Dependencies, and Their Impact on Failures"](https://www.researchgate.net/profile/Jeffrey_Roberts2/publication/220070820_Software_Dependencies_Work_Dependencies_and_Their_Impact_on_Failures/links/0046352651c19d5aef000000/Software-Dependencies-Work-Dependencies-and-Their-Impact-on-Failures.pdf)) --- ## Discussion What did you take away from the papers? #### a) "The Effect of Branching Strategies on Software Quality" * ... * ... --- ## Discussion What did you take away from the papers? #### b) "Software Dependencies, Work Dependencies, and Their Impact on Failures" * ... * ... --- ## Discussion #### What research method is used in the papers? * ... * ... <!-- * empirical quantitative study * collect development data from VCS history - Not Git likely! - Type of change (development/branching) - on which branch am I? * binaries for Windows Vista & 7 * Issues reports - meaning of change, am I a bug fix, etc. --> --- ## Discussion #### What are the key results? <!-- a) Likely a good idea to organize branching activity along organizational structures --> - a) "The Effect of Branching Strategies on Software Quality" * ... * ... - b) "Software Dependencies, Work Dependencies, and Their Impact on Failures" * ... * ... --- ## Discussion #### Observations * ... * ... <!-- * Some places do not branch instead, they rely on multiple repositories per team (of "unrelated") * Microsoft results are likely first relevant from a certain size of organization * Organization changes likely faster that architecture * perhaps a weird setup to compare Windows Vista & 7 (two quality extremes) --> --- ## Recap: Git Branching -- ### What is a Branch? * Git stores as a series of snapshots. * Commit objects contain a pointer amongst others a snapshot of the staged content and zero or more pointers to direct parents of this commit: -- * First commit: _zero_ parents * Normal commit: _one_ parent * Merging commit: _multiple_ parents --- ### What is a Branch? A _branch_ in Git is simply a pointer to a commit. The default branch name is `master`. Every time you commit, the pointer moves forward automatically.  --- ### Recap: Branching Strategies > “We are a team of four senior developers (by which I mean we’re all over 40 with 20+ years each of development experience) and not one of us has had a positive experience in the past with branching the mainline... The branch is easy - it’s the merge at the end that’s painful”. > > [Phillips et al. _"Branching and Merging: An Investigation into Current Version Control Practices"_](http://citeseerx.ist.psu.edu/viewdoc/download?doi=10.1.1.278.6065&rep=rep1&type=pdf) --- #### Long-Running Branches/Branch by Release   <!-- Figure 1. of [Walrad et al. _"The Importance of Branching Models in SCM"_]( https://www.researchgate.net/profile/Chuck_Walrad/publication/2955749_The_importance_of_branching_models_in_SCM/links/0c960536418f2f0da4000000/The-importance-of-branching-models-in-SCM.pdf) --> --- #### Topic Branches/Branch by Purpose A topic branch is a short-lived branch that you create and use for a single particular feature or related work.  --- #### Topic Branches/Branch by Purpose After merging `iss91v2` and `dumbidea` and throwing away the original `iss91` branch (losing commits C5 and C6) the repository's history looks as in the following: <img src="http://git-scm.com/figures/18333fig0321-tn.png" width="30%"> --- #### Git-Flow Read on it here: http://nvie.com/posts/a-successful-git-branching-model/ <img src="http://nvie.com/img/git-model@2x.png" width="50%"> --- #### No Branches/Trunk-based Development > Almost all development occurs at the “head” of the repository, not on branches. This helps identify integration problems early and minimizes the amount of merging work needed. It also makes it much easier and faster to push out security fixes. > > Henderson [_"Software Engineering at Google"_](https://arxiv.org/pdf/1702.01715.pdf) -- ##### Release Branches <img src="https://trunkbaseddevelopment.com/trunk1a.png" width="60%"> -- ##### No Branches <img src="https://trunkbaseddevelopment.com/trunk1b.png" width="60%"> > A release typically starts in a fresh workspace, by syncing to the change number of the latest “green” build (i.e. the last change for which all the automatic tests passed), and making a release branch. The release engineer can select additional changes to be “cherry-picked”, i.e. merged from the main branch onto the release branch. Then the software will be rebuilt from scratch and the tests are run. If any tests fail, additional changes are made to fix the failures and those additional changes are cherry-picked onto the release branch, after which the softwarewillberebuiltandthetestsrerun. Whenthetestsallpass,thebuiltexecutable(s)and data file(s) are packaged up. All of these steps are automated so that the release engineer need only run some simple commands, or even just select some entries on a menu-driven UI, and choose which changes (if any) to cherry pick. > > Henderson [_"Software Engineering at Google"_](https://arxiv.org/pdf/1702.01715.pdf) <!-- --- #### Other Branching Models * **Github-Flow**: http://scottchacon.com/2011/08/31/github-flow.html * Platform Branches http://www.creativebloq.com/web-design/choose-right-git-branching-strategy-121518344 ![]http://cdn.mos.cms.futurecdn.net/4c32e6c4a3a45756ab06b9f54b904f69-650-80.jpg) --> <!-- * New Feature Version Branches: https://ustwo.com/blog/branching-strategies-with-git/  * http://www.kumaranuj.com/2015/11/gi-branching-strategies.html --> --- ## Which Branching Model does Microsoft Use? In the paper [_"The Effect of Branching Strategies on Software Quality"_](https://www.microsoft.com/en-us/research/wp-content/uploads/2016/02/shihab-esem-2012.pdf) the authors describe how Microsoft used branches when building Windows 7 and Windows Vista. Which branching model is it? * ... * ... --- ## Let's do some research!  <!-- ## RQ0: With which branching models are the studied SW systems built? --> --- ## Relation between branching and SW quality? > We find that, indeed, branching does have an effect on software quality... > > E. Shihab et al. ["The Effect of Branching Strategies on Software Quality"](https://www.microsoft.com/en-us/research/wp-content/uploads/2016/02/shihab-esem-2012.pdf) * Is that true for open-source projects too? * That is, for software that is developed in a globally distributed manner, can we find an effect of branching to defects? --- ## Research Question #### Is there a correlation between branching activity and software quality? -- * _Branching activity_: Let's consider it as the amount of merge commits. This is what Shihab et al. and Phillips et al. describe as the real issue. * _Software quality_: Let's consider the amount of reported defects as proxy for software quality. That is, we consider tickets that are labeled as bugs in an issue tracker as defect reports. <!-- ## RQ2: Are there metrics, such as size of commit, number of developers working on it, or similar (you choose) that are possess a stronger correlation to SW quality compared to branching activity? --> --- ## What do we need to investigate the RQ? - a) ... - b) ... - c) ... - d) ... --- ## What do we need to investigate the RQ? ### a) Some case systems I suggest that we have a look at some systems from the Apache Software Foundation, e.g., * [Apache Accumulo](https://github.com/apache/accumulo) * [Apache Camel](https://github.com/apache/camel) * [Apache Ignite](https://github.com/apache/ignite) --- ## What do we need to investigate the RQ? ### b) Defect Reports Most Apache projects use JIRA as issue tracker. Let's use tickets labeled as _bug_ as a proxy for software quality. * [Apache Accumulo JIRA](https://issues.apache.org/jira/projects/ACCUMULO/issues) * [Apache Camel JIRA](https://issues.apache.org/jira/projects/CAMEL/issues) * [Apache Ignite JIRA](https://issues.apache.org/jira/projects/IGNITE/issues) Let's count the **number of defect reports per week**. --- ## What do we need to investigate the RQ? ### c) History with merge commits of each system Most Apache projects are hosted or mirrored on Github. * [Apache Accumulo](https://github.com/apache/accumulo) * [Apache Camel](https://github.com/apache/camel) * [Apache Ignite](https://github.com/apache/ignite) Let's count the **number of merge commits per week**. --- ## What do we need to investigate the RQ? ### d) Ability to compute correlation statistics and plotting Is there a correlation between the **number of defect reports per week** and the **number of merge commits per week**? How do the **number of defect reports per week** and the **number of merge commits per week** look when plotted in a scatter plot? Likely Spearman's ρ is perhaps a good correlation coefficient to compute. --- ## What do we need to investigate the RQ? - a) Some case systems - b) Defect Reports - c) History with merge commits of each system - d) Ability to compute correlation statistics and plotting --- ## What do we need to investigate the RQ? <img src="images/overview.png" width="100%"> --- ### b) Defect Reports??? <img src="images/io_overview.png" width="100%"> --- ### b) Defect Reports??? From the JIRA API via `curl` in the terminal. ```bash curl "https://issues.apache.org/jira/"` `"rest/api/2/search?jql=project=accumulo+order+by+created"` `"&issuetypeNames=Bug&fields=id,key,priority,labels,versions,"` `"status,components,creator,reporter,issuetype,description,"` `"summary,resolutiondate,created,updated" ``` See JIRA API docs: * https://developer.atlassian.com/server/jira/platform/jira-apis-32344053/ * https://docs.atlassian.com/DAC/rest/jira/6.1.html --- ### b) Defect Reports??? Via a tool ([`requests` documentation](https://docs.python-requests.org/en/latest/)) that wraps HTTP requests nicely: ```python import requests jira_api_base_url = "https://issues.apache.org/jira/" page_length = 500 project = "accumulo" proj_jira_id = project.upper() start_idx = 0 url = ( jira_api_base_url + f"rest/api/2/search?jql=project={proj_jira_id}+order+by+created" + f"&issuetypeNames=Bug&maxResults={page_length}&" + f"startAt={start_idx}&fields=id,key,priority,labels,versions," + "status,components,creator,reporter,issuetype,description," + "summary,resolutiondate,created,updated" ) print(f"Getting data from {url}...") r = requests.get(url) r_dict = r.json() ``` --- ### c) History with merge commits of each system??? <img src="images/io_overview2.png" width="100%"> --- ### c) History with merge commits of each system??? Using `git` directly. ```bash git clone git@github.com:apache/accumulo.git git -C accumulo log ``` If you cannot remember, use the [lecture material from the last time we saw each other](https://github.com/HelgeCPH/2019_ase_behavioural_analysis). --- ### c) History with merge commits of each system??? Via a tool ([PyDriller documentation](https://pydriller.readthedocs.io/en/latest/)) that wraps `git` nicely: ```python import os from pydriller import Repository repo_name = "ignite" gh_repo = f"https://github.com/apache/{repo_name}.git" repo_path = os.path.join("data", "repositories", repo_name) repo = Repository(path_to_repo=gh_repo, clone_repo_to=repo_path) for commit in repo.traverse_commits(): print(f"{commit.hash[:10]}") ``` --- ### d) Ability to compute correlation statistics and plotting??? <img src="images/io_overview3.png" width="100%"> --- ### d) Ability to compute correlation statistics and plotting??? Using a plotting tool like `matplotlib` ([official documentation](https://matplotlib.org/stable/api/_as_gen/matplotlib.pyplot.scatter.html?highlight=scatter#matplotlib.pyplot.scatter)) directly. ```python import csv import matplotlib.pyplot as plt x_data = [2, 6, 12, 1, 23, 10, 8] # merges per week y_data = [5, 9, 3, 7, 11, 4, 7] # defects per week # Plot plt.scatter(x_data, y_data) plt.title("Project name") plt.xlabel("merges per week") plt.ylabel("defects per week") plt.savefig("plot.png") ``` <img src="images/plot_example.png" width="35%"> --- ### d) Ability to compute correlation statistics and plotting??? Likely Spearman's ρ is a good correlation coefficient to compute ```python from scipy import stats x_data = [2, 6, 12, 1, 23, 10, 8] # merges per week y_data = [5, 9, 3, 7, 11, 4, 7] # defects per week ρ, p = stats.spearmanr(x_data, y_data) print(ρ, p) ``` ``` -0.01801874925391118 0.9694153868031987 ``` See the documentation of `scipy` implementation: https://docs.scipy.org/doc/scipy/reference/generated/scipy.stats.spearmanr.html --- ### d) Ability to compute correlation statistics and plotting??? Via a tool ([`pandas` documentation](https://pandas.pydata.org/pandas-docs/stable/reference/api/pandas.DataFrame.plot.scatter.html)) that are meant for data analysis: ```python import pandas as pd import matplotlib.pyplot as plt df = pd.read_csv("frequencies_per_week.csv") df["created_week"] = pd.to_datetime(df["created_week"], utc=True) corr_index = df.corr(method="spearman")["bugs_per_week"]["merges_per_week"] title = f"Project name (ρ={corr_index:3f})" df.plot(x="merges_per_week", y="bugs_per_week", kind="scatter", title=title) plt.savefig("plot.png") ``` <img src="images/plot_example2.png" width="35%"> --- ### Assumption The previous example assumes that we have a CSV file `frequencies_per_week.csv` with contents like: ``` created_week,merges_per_week,bugs_per_week 012020,2,5 022020,6,9 032020,12,3 042020,1,7 052020,23,11 062020,10,4 072020,8,7 ``` --- ### What do we need to investigate the research question? <img src="images/io_overview4.png" width="100%"> -- Find example data, and code fragments in the repository of this session: https://github.com/HelgeCPH/ase-effect-branching-on-defects --- ### Who is doing what now? <!-- Converted with: ffmpeg -i videos/take1.mov -q:v 0 videos/take1.mp4 --> <video controls id="video1" style="width:600px;max-width:100%;"> <source src="videos/take1.mp4" type="video/mp4"> </video> --- class: middle # Group work, now!  --- ## Interpretation and Discussion of Results <img src="images/discussion.png" width="50%"> - Do our results support the findings of Shihab et al. or do they diverge from their findings? - What is the meaning of our results? - How trustworthy are they? ---